.svg)



Key Takeaways
- Eye tracking shows where users look and what catches attention.
- Fixations and saccades reveal how users scan digital interfaces.
- Heatmaps make user attention patterns easier to understand.
- Eye tracking works best alongside other UX research methods.
- Gaze data can guide clearer, more effective design improvements.
A design can look perfect and still fail to guide the user’s eyes. That is why understanding what is eye tracking in UX matters a lot for modern product teams. Eye tracking shows how users visually move through an interface.
The method works by recording eye movements as users view a website, app, or prototype. Designers can then study where people look, how long they focus on an element, and how their eyes move between different parts.
Used correctly, eye tracking can make UX research more practical and evidence-based. So what catches your users’ eyes first, and how to create better UX from it? Keep reading to find out!
What Is Eye Tracking in UX?
Eye tracking is a UX research method that measures a user's gaze and eye movements while they interact with a website, app, prototype, or other digital interface. Rather than asking users what they noticed, eye tracking records what they actually notice.
This technique captures the raw, moment-to-moment path their eyes take across a screen. This distinction is important. People are not always reliable narrators of their own attention.
A user might insist they saw a promotional banner clearly, when gaze data shows their eyes barely paused on it before moving elsewhere. Eye tracking closes that gap between perceived behavior and actual behavior and gives usability testing a layer of objective evidence.

In practice, eye tracking is rarely used in isolation. It works best alongside other user experience research methods. This provides a visual record of attention that can be cross-checked against what users say, what they click, and how long tasks take them to complete.
That combination is what makes it such a valuable addition to a UX researcher's toolkit.
How Does Eye Tracking Work?
At a high level, an eye tracker captures a user's eye movements and converts them into gaze data(a continuous record of where someone is looking, moment by moment, as they view a screen).
In order to do this, it takes both the right hardware and the right process:
How Eye-Tracking Technology Captures Gaze
Eye trackers rely on cameras paired with infrared light aimed at the eyes. The light creates a reflection on the cornea, while the camera separately tracks the pupil's center.
By measuring the angle between these two points, software calculates exactly which direction each eye is pointed, many times per second.
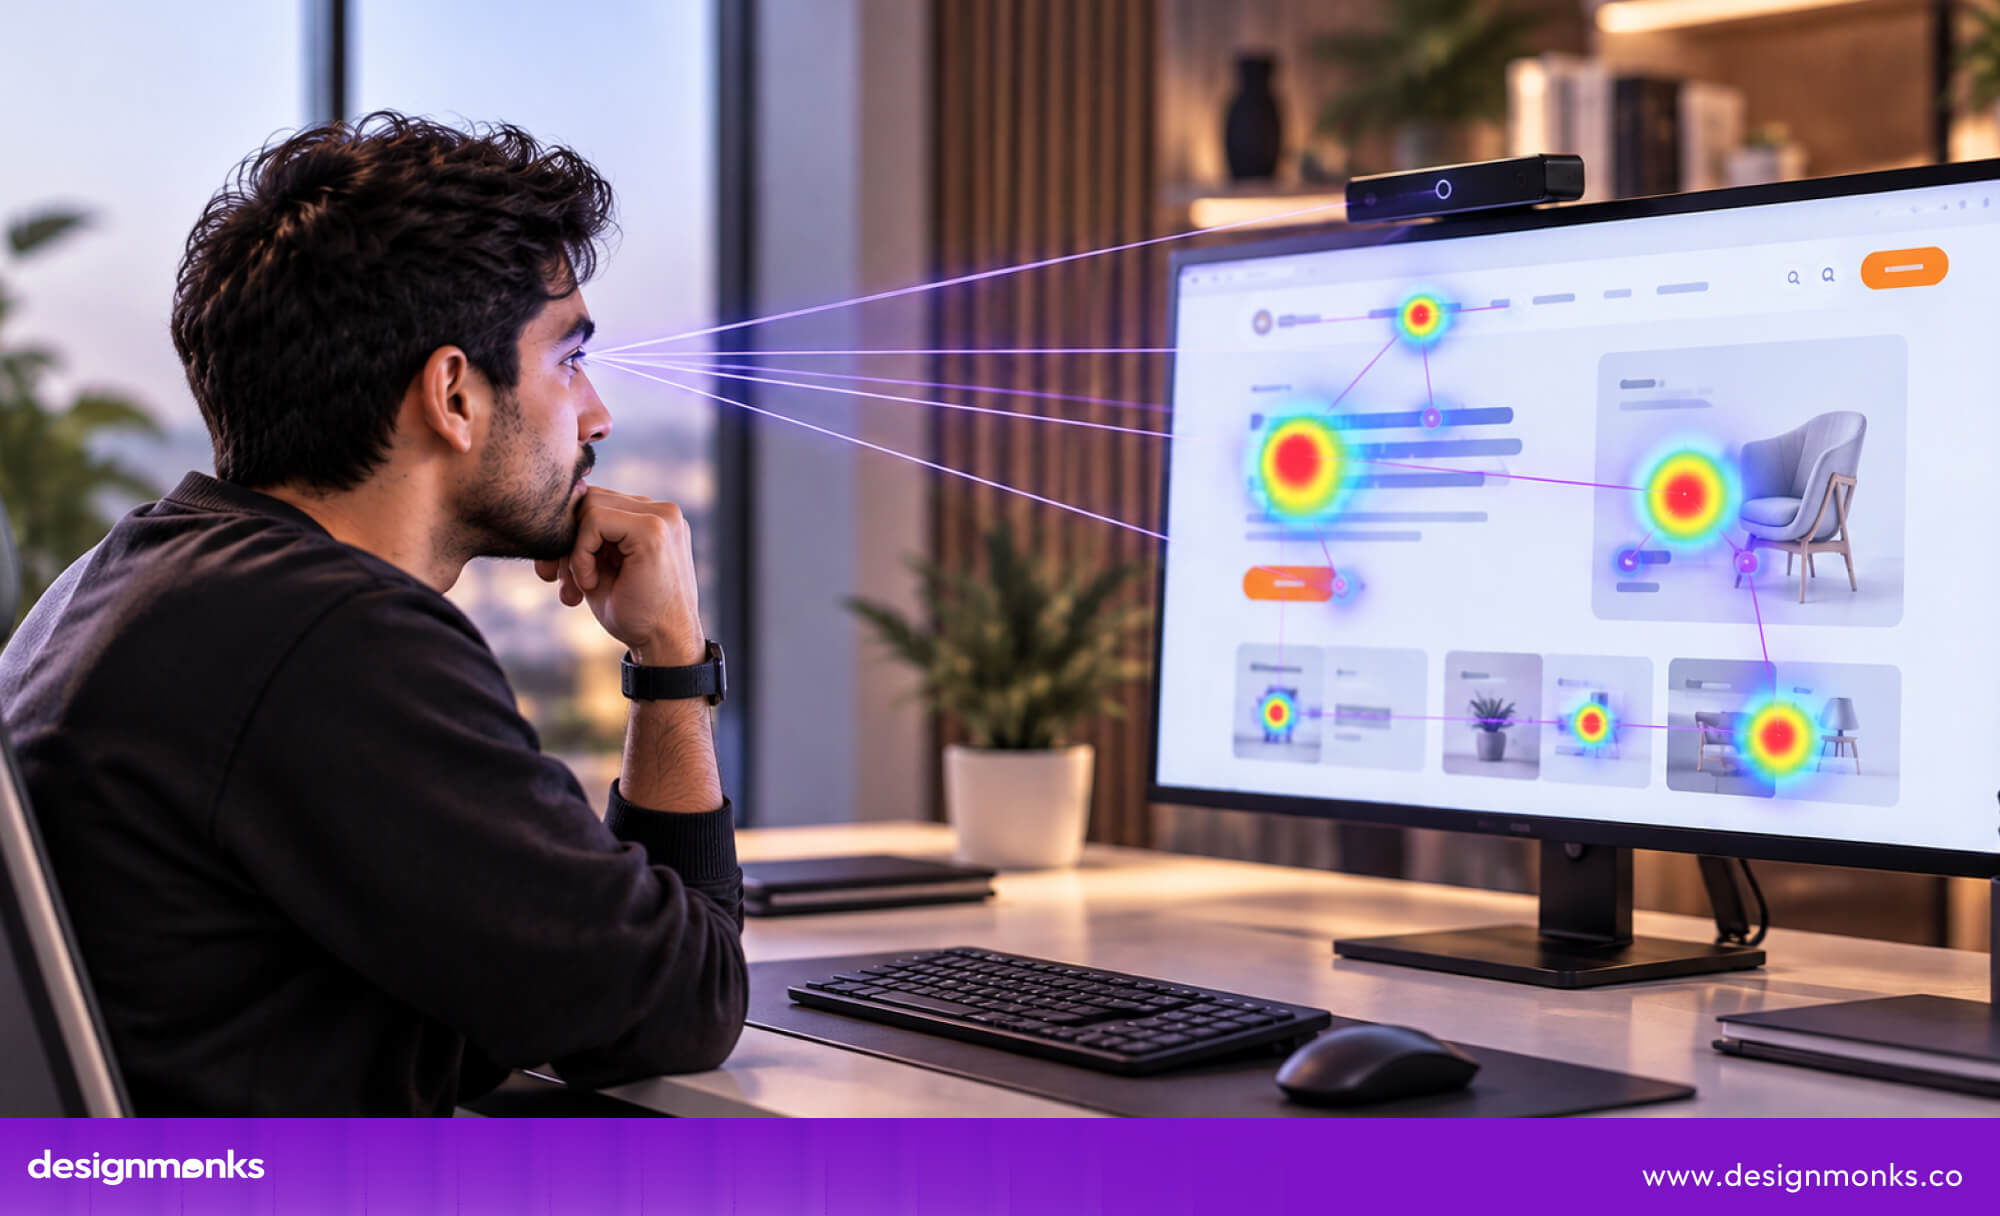
Knowing direction isn't enough on its own. The system still has to translate it into an actual point on the screen. That's where calibration comes in.
Participants look at a series of known on-screen points so the software learns how their specific eye angles map to screen coordinates. If they skip this step, the tracker may detect that someone is looking at the screen but get it wrong.
As a result, it will produce unreliable data before a study even begins.
The Eye-Tracking Study Process
A well-run eye-tracking study tends to follow a fairly consistent process:
- Define the research question: What do you actually want to learn? Whether users notice a CTA, how they scan a homepage, or which parts of a form cause hesitation.
- Recruit participants: Ideally, people who reflect your actual target users, as attention patterns can vary by familiarity, age, and context.
- Calibrate the tracker: Each participant needs to be calibrated individually before testing begins.
- Perform tasks: Participants complete realistic tasks, such as finding a product or completing a checkout, while the tracker records their gaze.
- Collect gaze data: Fixations, saccades, and other metrics should be logged automatically throughout the session.
- Analyze results: Researchers review heatmaps, gaze plots, and quantitative metrics to identify patterns.
- Improve design: Findings are translated into concrete design changes, which can then be retested.
Nielsen Norman Group, one of the most cited authorities in usability research, places particular emphasis on the planning stages of this process. It includes study design, participant recruitment, calibration, and careful task design.
Skipping these steps tends to produce noisy, hard-to-interpret data, no matter how sophisticated the eye-tracking hardware is.
How is Eye Tracking Measured in UX?
Eye tracking produces several core measurements that form the foundation of most analyses. But these findings don't require an advanced background in vision science to understand:
Fixations
A fixation happens when the eyes stay focused on one spot or small area for a short time. This is when the brain takes in and processes visual information.
In eye-tracking research, designers often look at how long users fixate and how many times they look at an element.
Many fixations can mean strong interest, but they can also mean confusion. That’s why fixation data is usually studied along with other user behavior and research findings.
Saccades
Saccades are the quick eye movements people make when looking from one point to another. Eye trackers can record these movements and show how users scan a page.
For example, users may move their eyes from top to bottom in a clear pattern or jump between different sections. An unusual or messy scanning pattern may suggest that the layout is confusing.
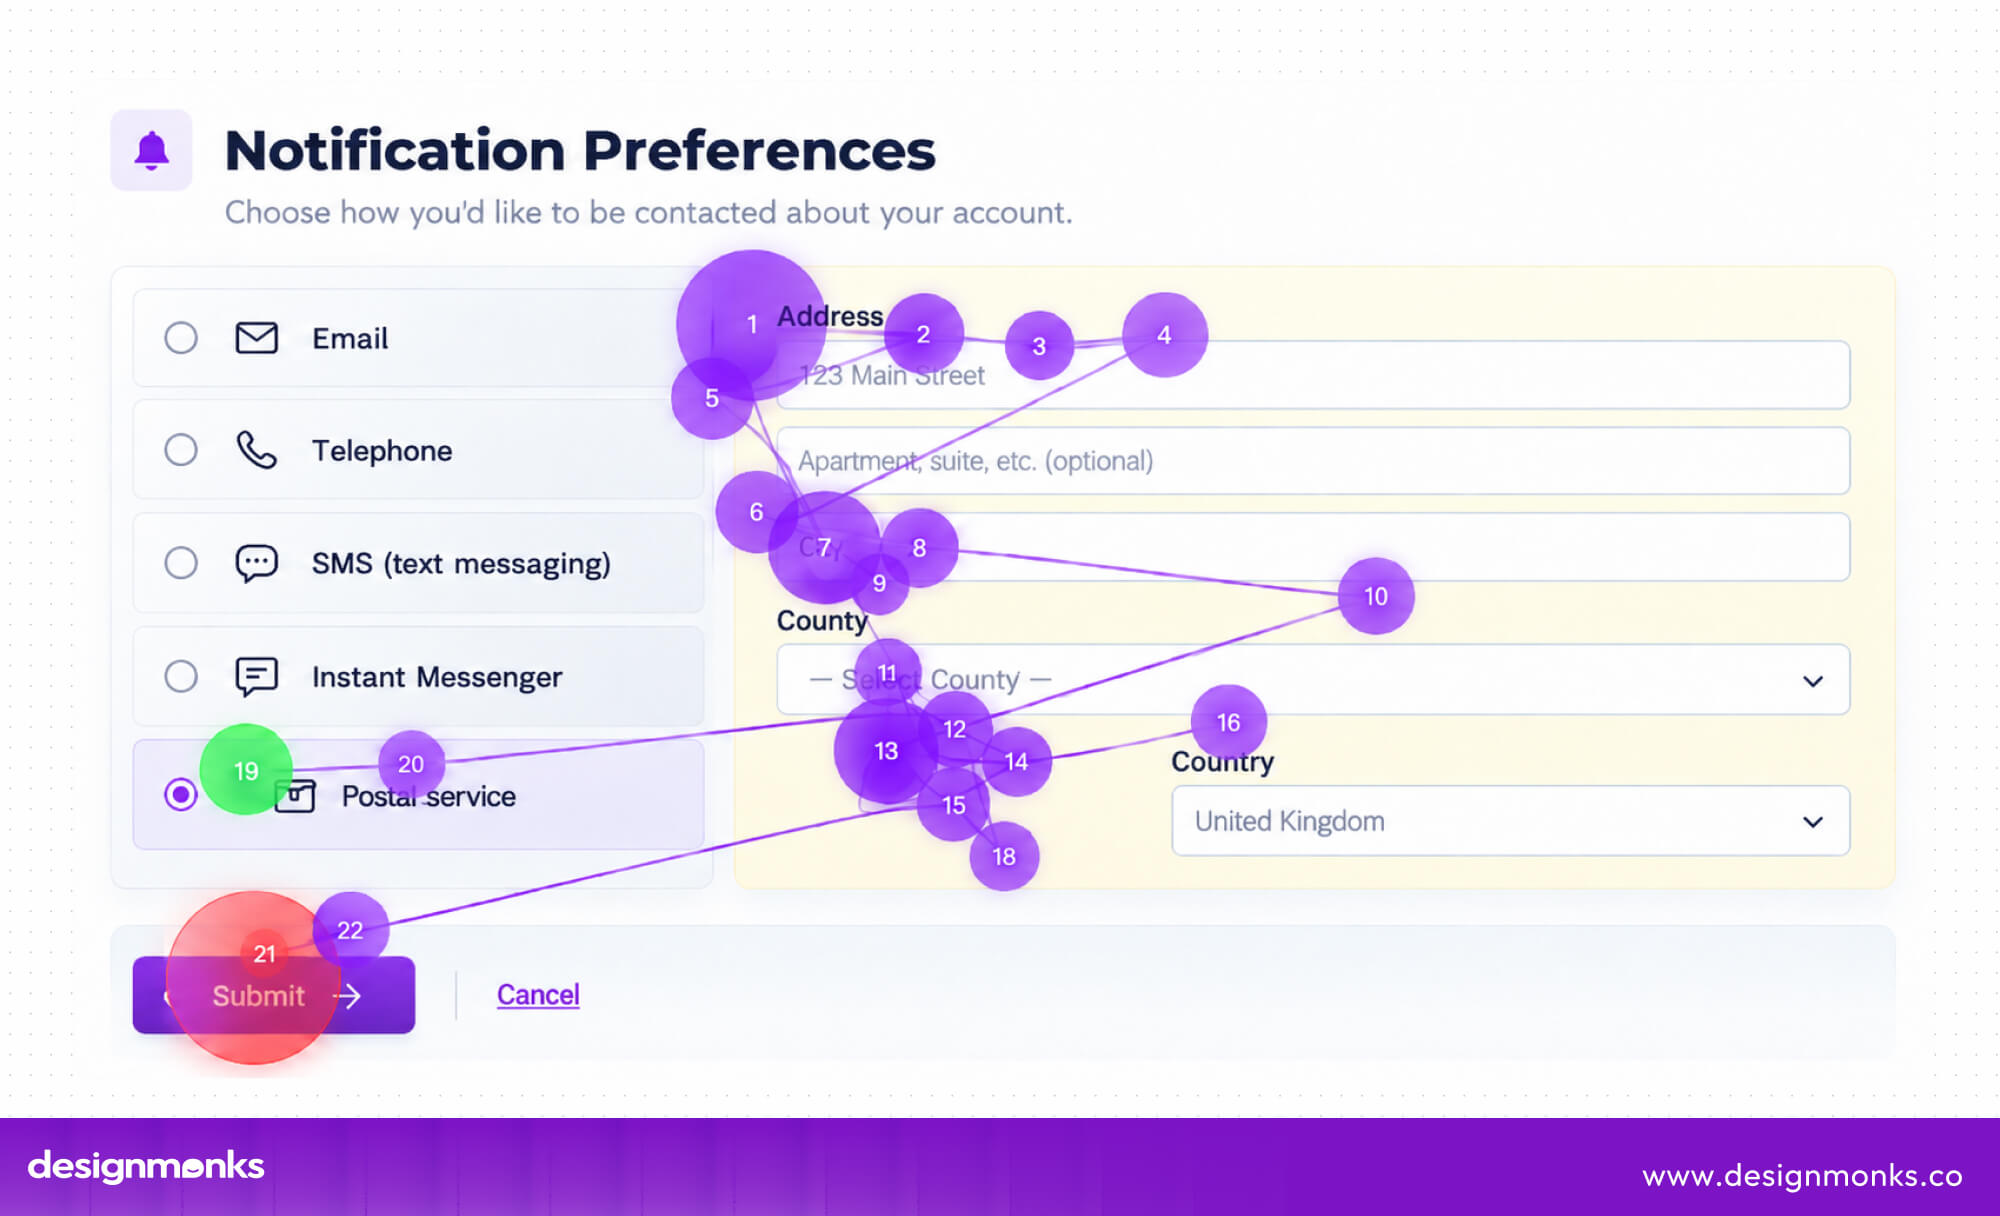
The image above shows where a user looked while completing a form on a webpage. The green circle marks where their eye tracking started, while the red circle shows where it ended.
What stands out is that some parts of the form were never looked at. This shows an important UX lesson that just because something is on a webpage does not mean users will notice it.
Time to First Fixation
Time to First Fixation measures how quickly a user notices a specific element after a page or screen appears. It can help designers see whether important elements, such as a CTA button or pricing information, are easy to find or get lost among other content.
Areas of Interest (AOIs)
Areas of Interest, or AOIs, are specific parts of a screen that researchers choose to study. These could include a navigation bar, CTA button, image, or form field. Researchers can then compare things like how often users look at each area and how quickly they notice it.
Two other related terms worth knowing for eye tracking are pupillometry and blink rate. Pupillometry measures changes in pupil size that can indicate cognitive load or emotional arousal.
Blink rate, on the other hand, correlates with concentration or fatigue. These are typically used as supporting signals rather than primary metrics in mainstream UX research.
What Are the Main Eye-Tracking Visualizations?
Raw gaze data on its own is just a long list of coordinates and timestamps. Visualizations are what turn that data into something a design team can actually interpret and act on:
Eye-Tracking Heatmaps
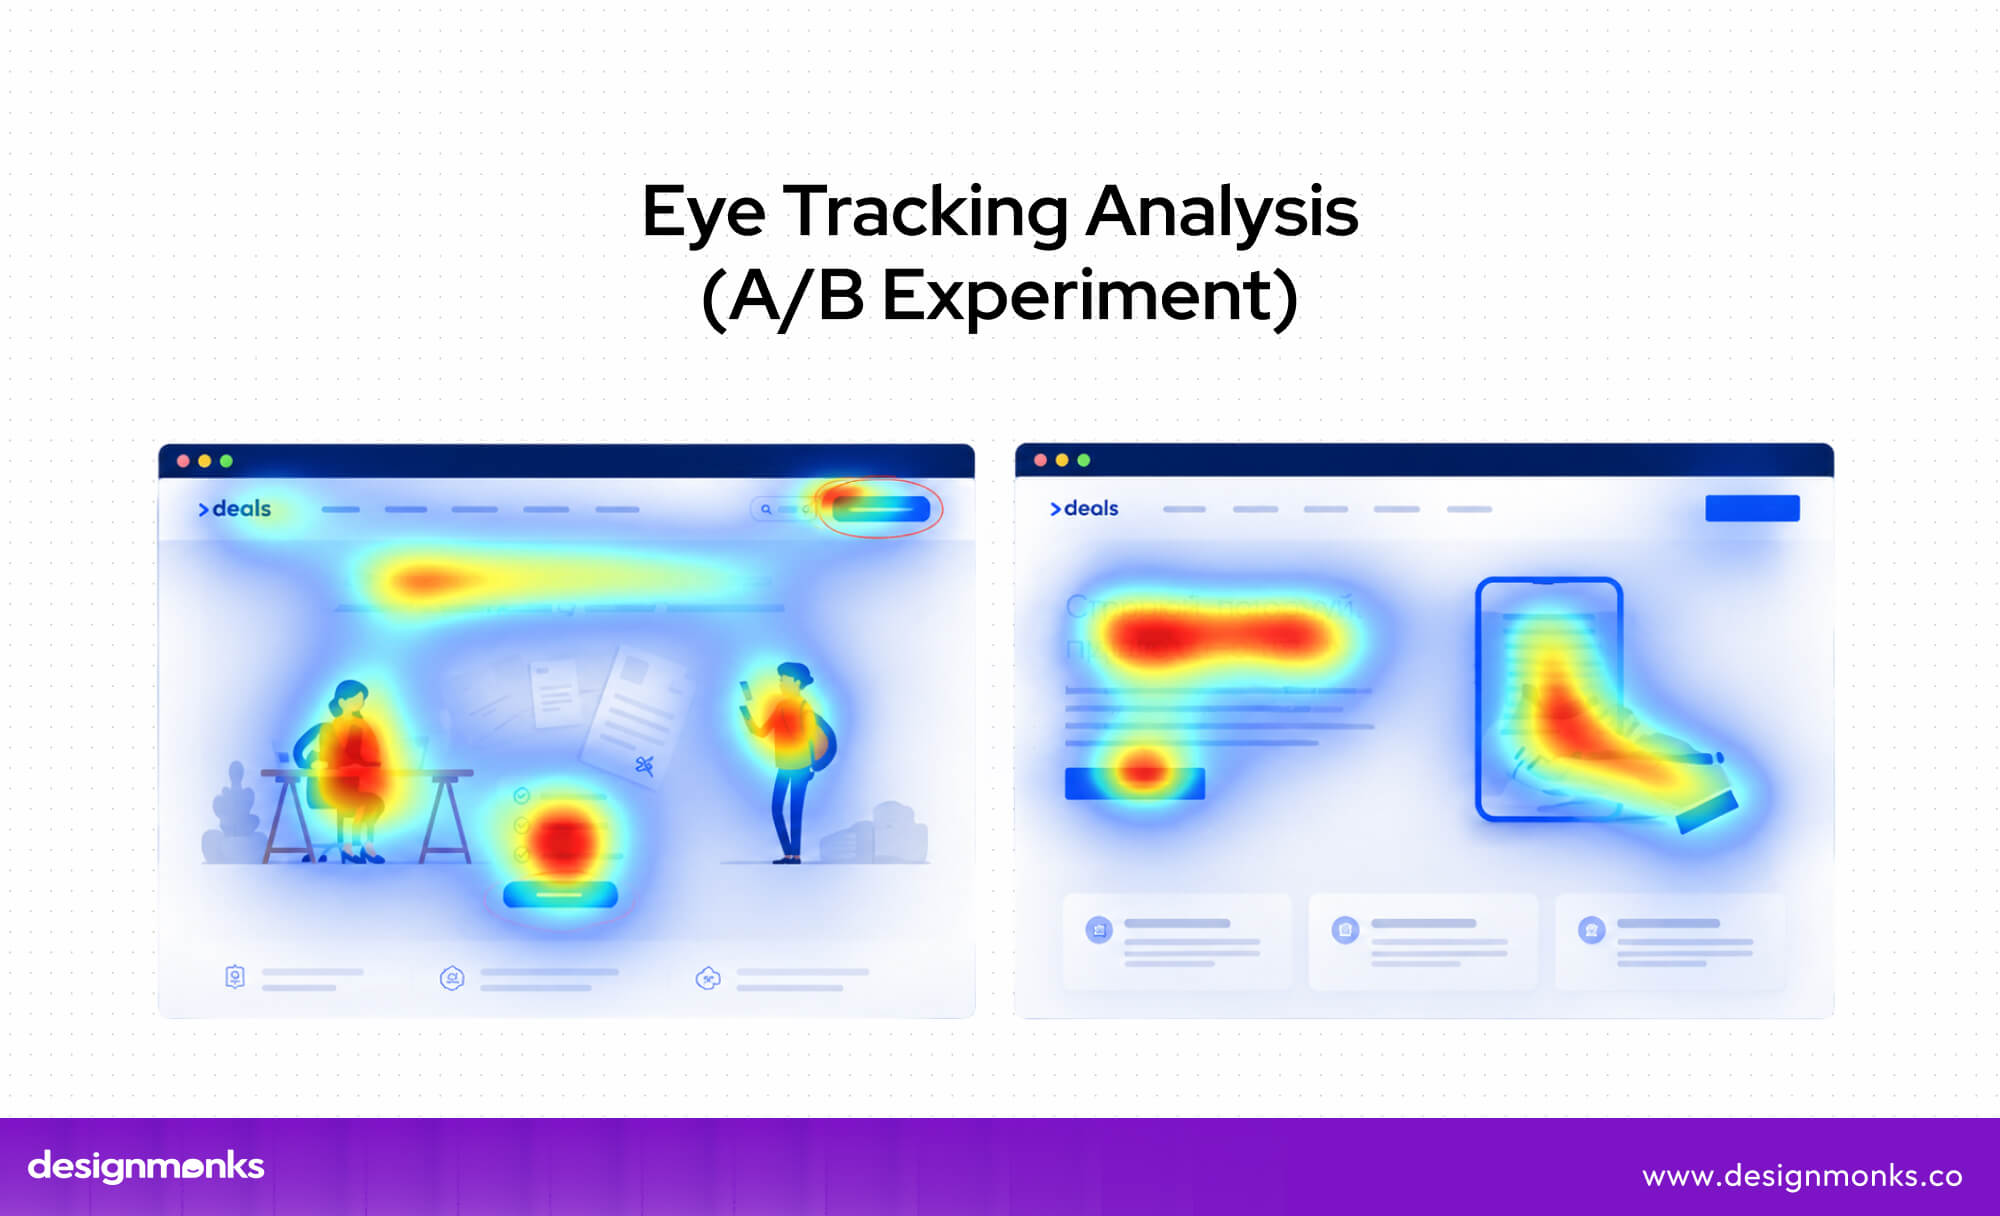
A heatmap combines eye-tracking data from one or more users and displays it over a design using colors. Areas that receive more attention appear in warm colors like red and orange, while areas with little or no attention appear in cooler colors or remain uncolored.
Heatmaps make it easy to see what catches users’ attention and what they overlook. For example, a heatmap may show that users focus on a headline but miss an important CTA button.
This can help designers improve the layout, visual hierarchy, and content placement.
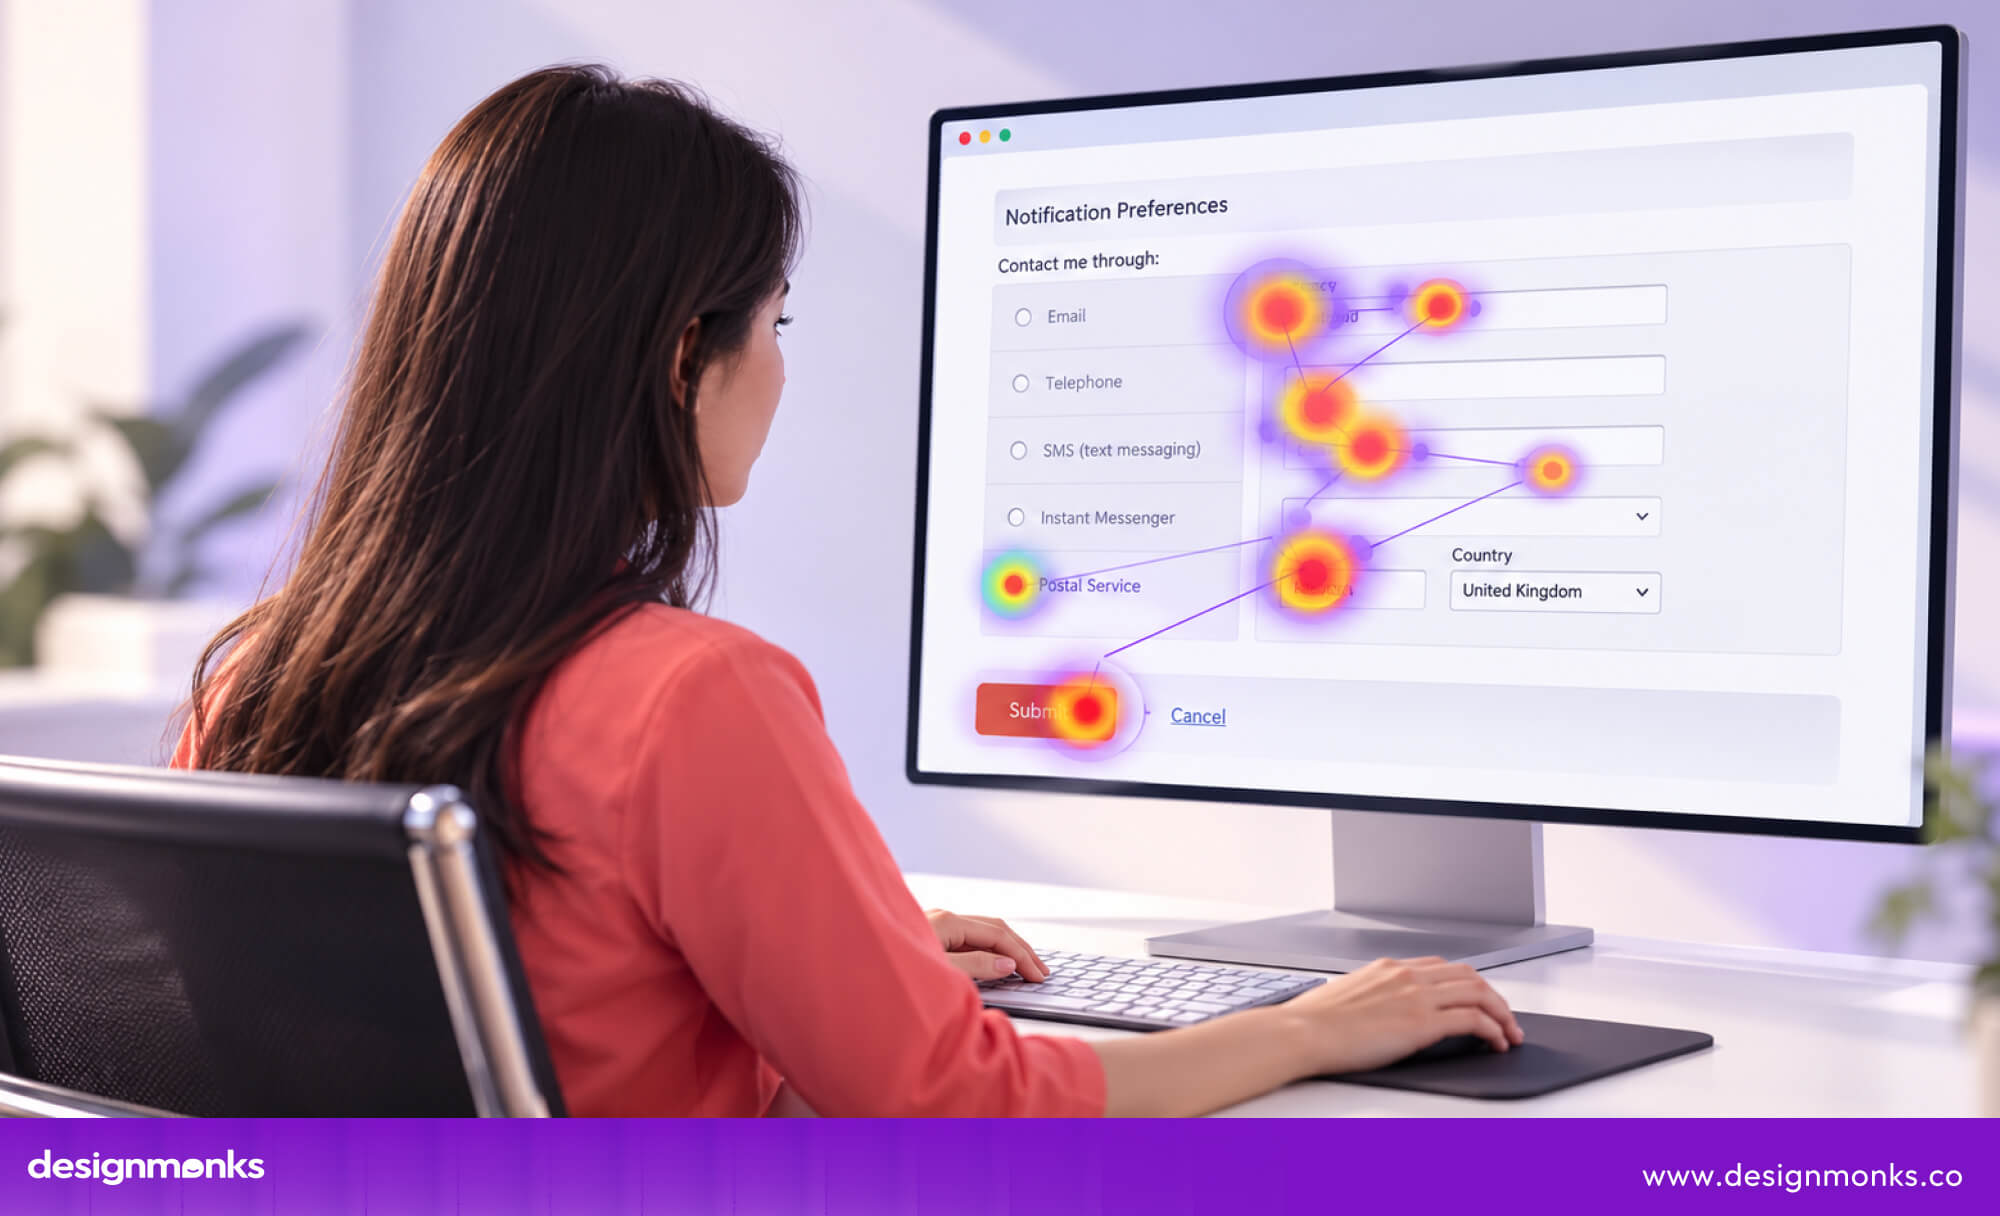
However, heatmaps show where users look, not why they look there. So, they work best when combined with other UX research methods.
Tools for Creating Eye-Tracking Heatmaps
Here are some tools for creating eye-tracking heatmaps:
- Tobii Pro: Professional eye-tracking hardware and software for UX research.
- RealEye: Web-based eye tracking that uses webcams to study visual attention.
- EyeQuant: AI-powered tool that predicts visual attention in designs.
- Hotjar: Provides click and scroll heatmaps. It is not traditional eye tracking but can support UX research.
Note: Eye-tracking heatmaps show where users look, while click and scroll heatmaps show where users interact or how far they scroll.
Gaze Plots and Scanpaths
While heatmaps show overall user attention, gaze plots and scanpaths show the order of a user’s eye movements during a session.
A gaze plot shows the points where users looked, while a scanpath connects those points to show the order and path of their visual attention.
This can help designers spot navigation problems.
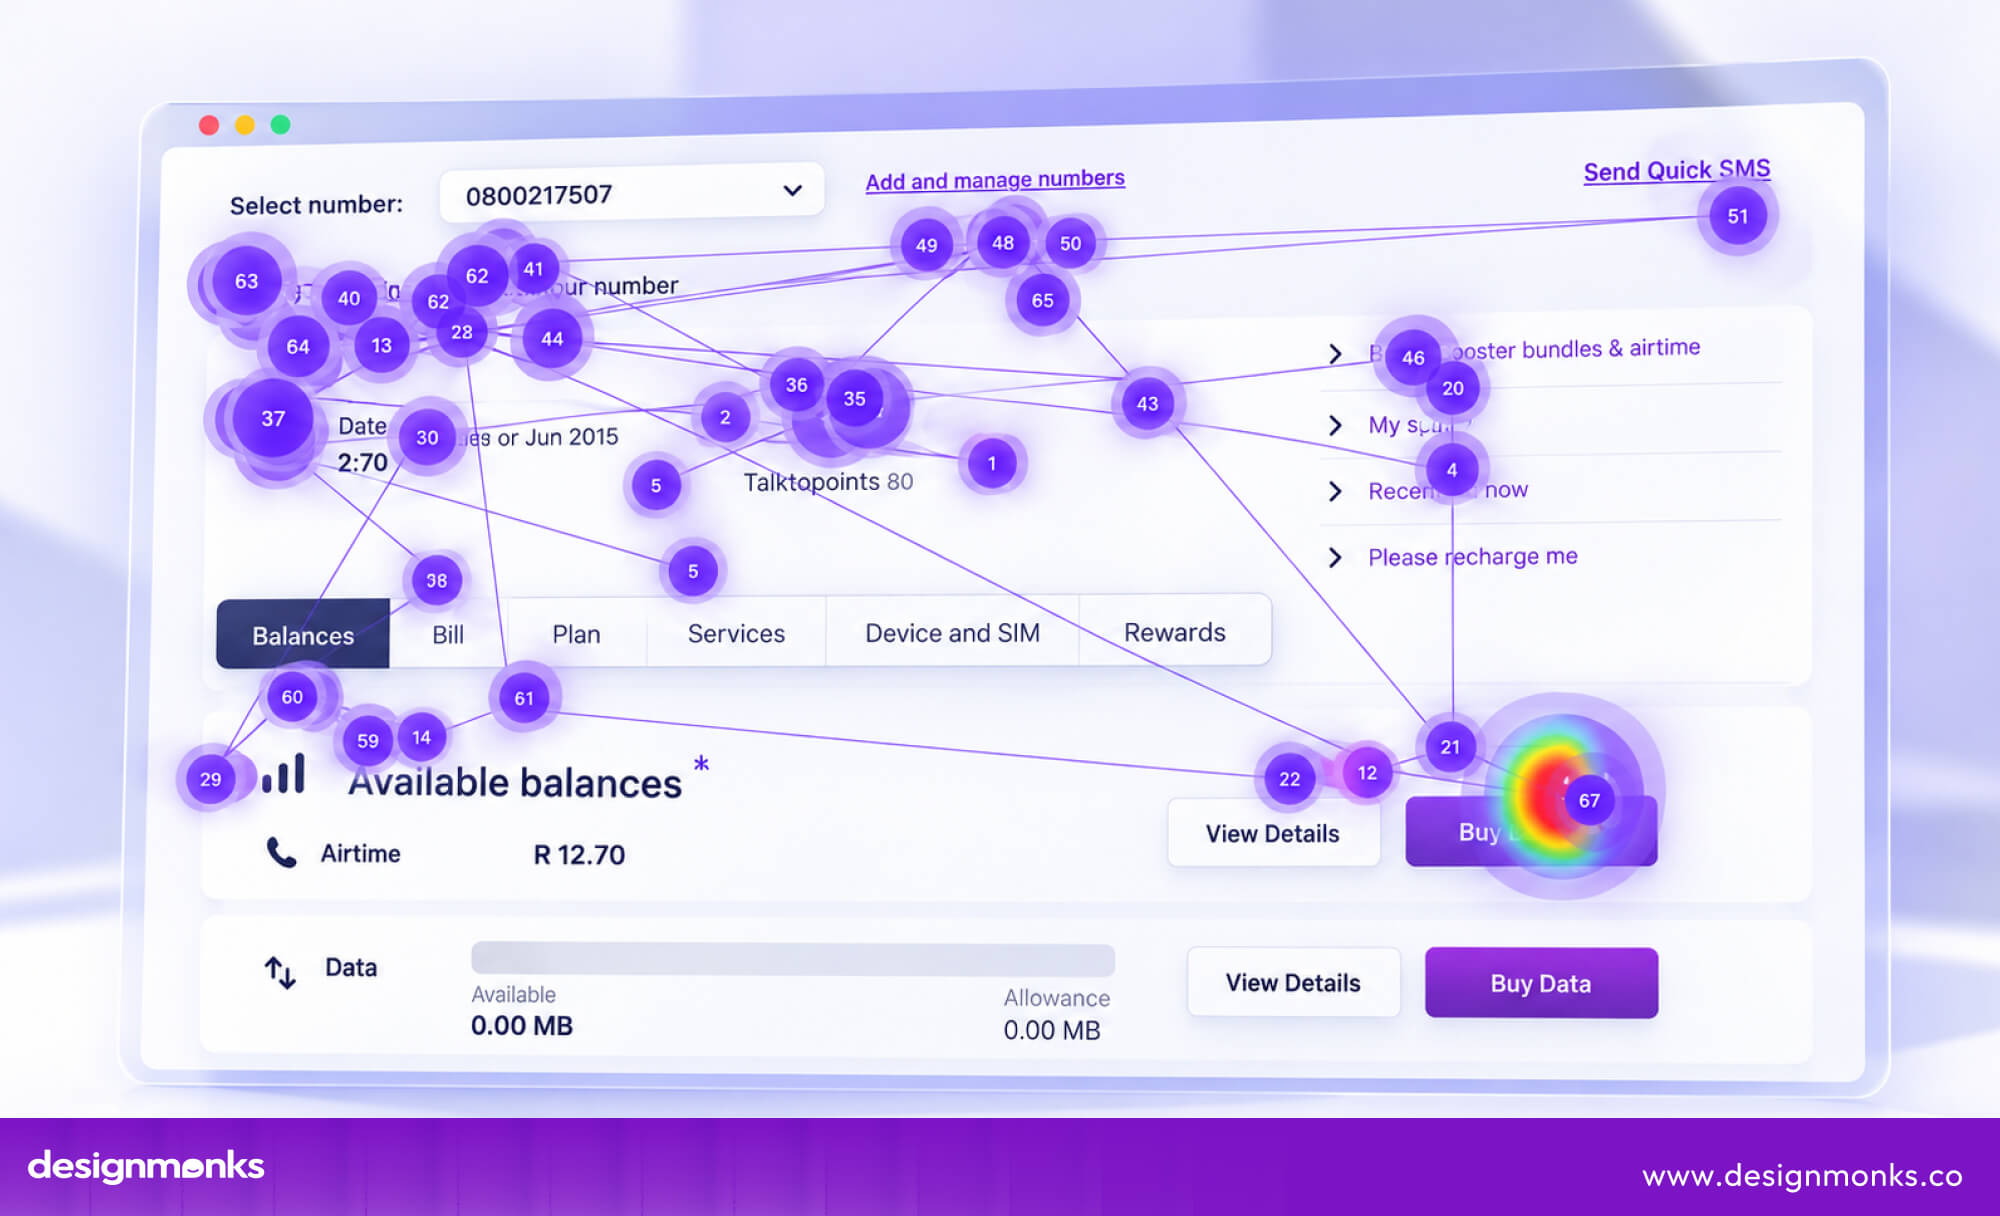
For example, a scanpath that repeatedly moves between two areas may mean the user is comparing options or having trouble finding information. Other visual tools include gaze replay, which lets researchers watch a user’s eye movements as they happened.
Perception maps and AOI reports can also provide more detailed information about how users viewed specific elements.
One important point to be noted is that more attention does not always mean more interest. A user may look at something for a long time because they are confused or unsure what to do.
Eye-tracking data needs context to understand what the user is actually experiencing.
How Eye Tracking is Used in UX Research
Eye tracking is most useful when it helps designers make better product decisions. Here are some common ways UX teams use it:
Testing Visual Hierarchy
Eye tracking can show whether users notice content in the order the design intended. For example, on a homepage, designers may want users to first see the headline, supporting text, and then CTA in that order.
Eye tracking can show if users follow this path or focus on something else.
Evaluating Website and App Navigation
Eye tracking can help find navigation problems. If users repeatedly look past a menu item without noticing it, the label, position, or design may need improvement.
Testing Prototypes and New Designs
Designers can use eye tracking on early designs, prototypes, and mockups before launch. This helps them find visual problems while changes are still easy and less expensive to make.
Understanding User Attention
Eye tracking adds useful behavioral data to usability tests, interviews, and analytics. It helps teams understand where users look, how they move through a screen, and which parts of a product may cause problems.
What Are the Benefits of Eye Tracking in UX?
Eye tracking gives designers a clearer view of where users look and what catches their attention. Some key benefits are:
- Shows what users actually look at instead of relying only on what they remember.
- Finds overlooked elements, such as CTAs, menus, or important information.
- Tests visual hierarchy to see if users notice important content first.
- Shows how users scan a page and move between different elements.
- Adds real behavior data to usability tests and user feedback.
- Helps compare designs and see if a new version gets more attention in the right places.
Eye tracking works best when its findings are combined with other UX research rather than used on their own.
What Are the Limitations of Eye Tracking in UX?
Eye tracking can provide useful insights, but it also has some limitations:
- Looking does not always mean understanding: A user may look directly at an element without noticing, reading, or understanding its meaning.
- Peripheral vision is not fully captured: Eye trackers mainly record where users look directly, so they may miss information users notice from the side of their vision.
- Eye-tracking equipment can be expensive: Professional devices, testing spaces, and trained researchers can make eye-tracking studies costly.
- Results can be affected by data quality: Poor calibration, user movement, glasses, or lighting can make eye-tracking results less accurate.
- Eye-tracking studies can take more time: Recruiting participants, setting up equipment, running tests, and analyzing the data can take longer than basic usability tests.
- Gaze data does not explain user intent: A heatmap shows where users looked, but it cannot tell you if they were interested, confused, or simply trying to find something.
Overall, eye tracking is not a complete measure of user attention. It works best when combined with usability testing, interviews, task results, and other research methods.
How Eye Tracking Works With Traditional UX Research Methods
Eye tracking is not meant to replace traditional UX research. Instead, it adds another layer of information. Each ux research method answers a different question, so using them together can give designers a much clearer picture of the user experience.
Eye tracking: Where do users look?
It records users’ eye movements and shows which parts of a screen attract attention. For example, you may discover that users look at a product image first but barely notice the “Buy Now” button. This can reveal problems with visual hierarchy that users may never mention.
Usability testing: What do users do?
It shows how users complete tasks and where they get stuck. A user might look directly at a menu but still fail to use it correctly. Eye tracking shows attention, usability testing shows the actual problem.
Interviews: What do users think and say?
Interviews help explain the reasons behind user behavior. If users spend a long time looking at a pricing section, an interview can reveal whether they were interested, confused, or comparing options.
Analytics: What happens at scale?
Analytics shows how thousands of real users behave. It can reveal patterns such as high drop-off rates, popular pages, or low conversion rates. A small eye-tracking study cannot show this.
Click and interaction heatmaps: Where do users interact?
These tools show where users click, tap, or scroll. This is different from eye tracking because looking at something does not mean interacting with it. A user may notice a CTA but choose not to click it.
Why Combine These Methods?
The most useful insight often comes from connecting the data.
Imagine users spend a lot of time looking at a CTA but rarely click it. Eye tracking tells you they noticed it, analytics shows the low conversion, and interviews may reveal that the CTA text does not build enough trust.
This is why eye tracking works best as part of a broader UX research strategy. Eye tracking tells you where attention goes, while other methods help explain what users do, what they think, and why they behave that way.
Together, they give designers stronger evidence for making design decisions.
How to Use Eye Tracking to Improve a UX Design
Collecting eye-tracking data is only the first step. The real value comes from using those findings to improve the design:
Start With a Clear UX Question
Decide what you want to learn before starting the study. For example, “Do users notice our CTA quickly?” is a clear question, while “Is our homepage good?” is too broad.
A specific question makes the research easier to run and understand.
Identify Important Areas of Interest
Choose the UI elements you want to study. For a CTA test, this could include the CTA button, nearby content, competing visuals, and surrounding space. This keeps the research focused.
Combine Gaze Data With Other UX Data
Eye tracking becomes more useful when combined with task results, user comments, clicks, and observation. For example, users may look at a CTA but still not click it. This could mean the problem is not visibility but trust, wording, or messaging.
Turn Findings Into Design Changes
Use the research findings to make clear design improvements:
- Users miss the CTA → Improve its size, contrast, or placement.
- Users struggle with navigation → Simplify the menu and make options easier to understand.
- Users spend too long on an element → Check if it is confusing, unclear, or poorly labeled.
After making changes, test the new design again to see if the problem has improved.
Eye Tracking UX Example
A case study of Bookingsweden shows how eye tracking can uncover UX problems that traditional testing may miss. The Swedish booking platform was preparing to launch in March 2019 and had already run dozens of user tests. But before going live, the team wanted deeper insight into how users were actually experiencing the interface.
Working with UX researchers at Visualix, the team used Tobii Pro’s eye-tracking–based user testing software to see participants’ gaze as they navigated the website. The results exposed several hidden friction points.
Some buttons were misinterpreted, and an important filter for finding accommodations near specific locations was easy to overlook. A key finding was that user confusion did not always lead to an obvious error.
In some cases, users simply looked at an element for 3-4 seconds before clicking. This signaled uncertainty that clicks and task-completion data alone could easily miss.
The team acted on these insights before launch and added pop-up descriptions for some tools, clarifying content around certain features, and changing cursor behavior on hover for some buttons. As a result, they had a very successful launch of their site.
This example highlights that eye tracking can turn invisible user hesitation into clear design insights. It helps teams fix friction before it affects real customers.
When Should UX Teams Use Eye Tracking?
Eye tracking is most useful when you want to understand where users look and what catches their attention. UX teams can use it to study:
- Visual hierarchy: Do users notice the most important elements first?
- Content discoverability: Can users find important information easily?
- Navigation: Do users notice and understand menus and links?
- CTA visibility: Do users notice buttons such as “Sign Up” or “Buy Now”?
- Attention patterns: Which parts of a page or screen get the most attention?
- Layout comparisons: Which of two designs guides attention more effectively?
- Task behavior: Where do users look while completing a task?
However, eye tracking is not needed for every UX study. If you only want to know whether users can complete a task, a regular usability test may be enough. You can watch users complete the task, check whether they succeed, and ask them to explain their actions.
Eye tracking is most valuable when the main question is about visual attention. For questions about behavior, understanding, or task success, other UX research methods may provide a clearer answer.
But if that becomes hard, you can always consult with ui/ux design agency like Design Monks to help out with proper research.
FAQs
What does eye tracking measure?
Eye tracking measures where a person looks, how long they look, and how their eyes move across a screen. Common metrics include fixations, saccades, time to first fixation, and attention within specific Areas of Interest (AOIs).
What is an eye-tracking heatmap?
An eye-tracking heatmap shows where users looked on a screen by placing colors over the design. Warm colors usually show areas that received more attention, while cooler colors or blank areas show less attention.
What are fixations and saccades?
Fixations are short moments when the eyes stay focused on one area. This is when people take in visual information. Saccades are the quick eye movements between these points. Together, they show how users move their eyes across a screen.
Is eye tracking a usability testing method?
Eye tracking is a UX research method that can support usability testing. It shows where users look, while usability testing shows what they do, where they struggle, and whether they can complete a task.
Is eye tracking better than usability testing?
Neither method is always better. They answer different questions. Eye tracking shows where users look, while usability testing shows what users do and whether they can complete tasks successfully. Using both can give UX teams a clearer view of the overall experience.


.avif)
.avif)
.avif)
.avif)


.avif)
.avif)
.avif)
.avif)







.avif)